
🚀 Performance Testing Essentials for Web Apps
Tags: Non-Functional Requirements, Performance, Load, Latency, Throughput, AB, HEY
🎯 Purpose
The purpose is to rapidly identify the major bottlenecks in an app’s response time and resource usage under specific load conditions.
🌱 Origin
The Performance Testing Tool ab (Apache Bench) was created by Adam Twiss in 1996, and the modern, rate-controlled alternative hey, developed by Jaana Burcu Dogan (rakyll) in 2016.
🧠 Essentials
Focus on three areas: Goals, Measurement, and Analysis.
1. Core Performance NFR Types
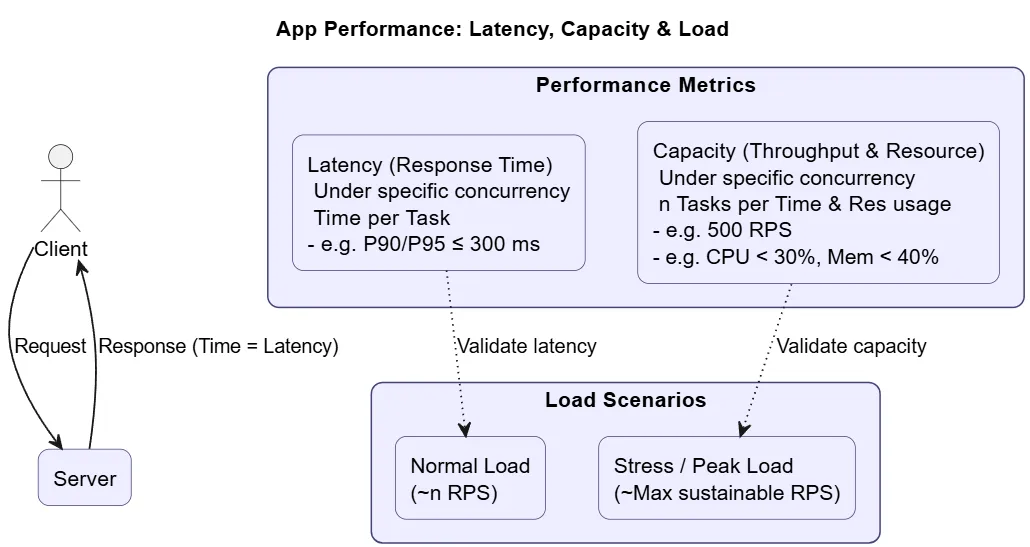
- Latency (Response Time): Ensuring the server responds quickly enough for the end-user. The target should be measured at the P90 or P95 percentile (e.g., 90% of requests must be $\le 300\text{ ms}$), while the system is subjected to a specific concurrency level.
- Capacity (Throughput & Resource): Ensuring the system can handle the expected number of requests without running out of CPU or memory. Key metrics are Requests Per Second (RPS) and sustained CPU/Memory usage under target load.
2. Common Load Profiles
- Normal Load: A controlled, low-to-moderate rate of requests matching typical daily usage (e.g., 2 RPS). Best for validating Latency NFRs.
- Stress/Peak Load: Pushing the system to its breaking point to find its maximum sustainable RPS. Best for validating Capacity NFRs and finding bottlenecks.
3. Measurement Tools
Two key CLI tools: one for speed (stress) and one for control (load).
| Tool | Focus | Use Case (80%) | Advantage |
|---|---|---|---|
ab (Apache Bench) | Speed & Throughput | Finding the server’s absolute maximum RPS (its breaking point). | Simple, ubiquitous, and fast. |
hey | Control & Pacing | Simulating a controlled, realistic load using a defined Rate Limit (RPS). | Precise control over the request rate (-q). |
4. Analysis Essentials
Focus on two primary sources of data to diagnose issues:
- Client-Side (Load Tool Output): Check the P90/P99 latency values in the
heyoutput to see if the NFRs are met. - Server-Side (System Monitor): While the test runs, use
htoporwatch+pson the server to ensure CPU and Memory remain below the defined limits.
🛠️ hey Hands-On
Usage of hey for controlled NFR verification because it allows rate limiting.
- Step 1: Linux Installation hey github repo
# 1. Download the executable binary (use current link from github repo)
wget https://hey-release.s3.us-east-2.amazonaws.com/hey_linux_amd64

# 2. Make it executable
chmod +x hey

# 3. Move it to a system path
sudo mv hey /usr/local/bin/

# 4. Verify
hey -h- Step 2: Run Backend and save its Process-Id
# Open new terminal (T1) and change to BE dir
cd [workspace/backend]
# Run BE
node server.js

# Open new terminal (T2) and Save BE PID of Node.js server to variable
PID=$(pgrep -f "node server.js")- Step 3: Execute Load-Test using Performance NFR Params
- Response Time: P90 $\le 300\text{ ms}$
- Resource Usage: CPU $\le 15%$ and Mem $\le 300\text{ MB}$ under a load of 2 Concurrent Users for 10 minutes.
- Simulation of a load of $\approx 1\text{ RPS}$ per user, totaling $600$ requests over $10$ minutes.
# -n 600: Total 600 requests
# -c 2: 2 concurrent workers (simulated users)
# -q 1: Rate limit of 1 query per second *per worker* (Total 2 RPS)
# -m POST: HTTP method
hey -n 600 -c 2 -q 1 -m POST http://localhost:3000/api/spin- Step 3: Resource usage Verification during Test Run
# Go to T2 and Monitor (for 10min) CPU and Memory (RSS in KB: Resident Set Size, used physical mem)
watch -n 5 "ps -p $PID -o %cpu,%mem,rss"
# %CPU < 15%; RSS < 307200KB (300MB).- Step 4: Response Time Verification after Test Run
- check latency distribution in
heyoutput.90% in [X] ms is le 300 ms
🛠️ ab Hands-On
- Step 1: Linux Installation
# 1. Install
sudo apt install apache2-utils

# 4. Verify
ab -h- Same Steps as Tool hey
- Only missing cmd option is
-q
All cheat sheets are taken from our Udemy Online Course. Interested? Check out:
All-In-One Full Stack DevOps - From Idea to Cloud